
Introduction
The vestibular system is a complex sensory network that integrates peripheral input with central processing to detect angular and linear accelerations of the head. This integration is fundamental for spatial orientation and stabilizing vision during motion via the vestibulo-ocular reflex (VOR). An optimal VOR function requires a gain close to 1.0, ensuring eye movements are equal and opposite to head motion to minimize retinal slip. When this reflex is impaired, patients experience oscillopsia and blurred vision, significantly reducing their quality of life.1–5
Dynamic visual acuity (DVA) serves as a critical behavioral measure of VOR functional integrity. While traditional bedside charts are often used, they lack reliability due to inconsistent head velocities. Computerized DVA (cDVA) has addressed these limitations by utilizing sensors to ensure optotypes appear only during controlled, high-velocity head movements.2,3
Despite vestibular rehabilitation being the gold standard for treatment,6 objective monitoring of functional recovery remains inconsistent. Physiologic tests (e.g., caloric testing or video head-impulse testing) assess structural integrity but often fail to correlate with a patient’s actual functional visual stability. Furthermore, current evidence regarding DVA changes during rehabilitation is limited by heterogeneous protocols and varying dosages.7–10 Consequently, there is a clear rationale for investigating whether cDVA can serve as a sensitive functional biomarker to complement traditional physiologic assessments.
This pilot study aimed to evaluate the preliminary sensitivity of cDVA measurements following a short-term (5-session) vestibular rehabilitation program in a heterogeneous clinical population. We hypothesized that a targeted rehabilitation program would result in measurable improvements in cDVA, reflecting neuroplastic adaptation in the central nervous system. In addition, the study sought to generate the effect-size data necessary to power future large-scale, controlled clinical trials.
Material and methods
Study design
This exploratory proof-of-concept used an observational cohort design conducted at a tertiary otoneurology service, extending from June 11, 2025, to February 1, 2026. The protocol was designed to assess the feasibility of a 5-session intervention within a clinically diverse cohort before proceeding to a randomized trial. Approval for this study was granted by the Research Ethics Committee.
Participants
A sample of 22 adults (20-80 years) referred for vestibular rehabilitation was recruited. To ensure the proof of concept reflected real-world clinical practice, we adopted broad inclusion criteria encompassing various vestibular dysfunctions. This heterogeneous diagnostic approach aimed to assess the intervention’s utility across the spectrum of otoneurologic pathologies encountered in tertiary care. Diagnosis was established via a comprehensive otoneurologic evaluation, requiring a history of non-positional vertigo or imbalance and abnormal clinical findings. Eligibility required completion of the full 5-session program and available pre- and post-intervention DVA data. Exclusion criteria included ocular pathologies that could confound visual acuity results, incomplete clinical records, or attrition before the final DVA assessment. The final analytic cohort represents the initial feasibility group used to generate effect-size estimates for future power calculations.
DVA assessment
DVA was selected as a behavioral outcome reflecting the functional consequences of VOR impairment rather than isolated physiologic gain measures.10,11 DVA was assessed using a computerized posturography system (EquiTest®, version 8.2.0). Testing parameters were standardized to control head velocity (110-140°/s), optotype presentation, and stimulus timing, with inertial sensors providing objective monitoring of head movement.9–10
Participants were seated 2.1 m from a 46-cm monitor with a refresh rate of 85 Hz and wore their habitual corrective lenses for distance vision. Static visual acuity (SVA) was assessed first using a single tumbling “E” optotype presented in random orientations (0°, 90°, 180°, and 270°). Five optotypes were displayed at each acuity level, decreasing in 0.1 logarithm of the minimum angle of resolution (logMAR) steps (−0.3, 0, 0.3, 0.7, 1.0, and 1.3 logMAR; Snellen equivalents 20/10-20/400). SVA was defined as the lowest logMAR level at which at least one optotype was correctly identified.
For DVA testing, a single-axis angular rate sensor was positioned on the participant’s head and aligned with the horizontal semicircular canal. Participants performed active horizontal head rotations. During rightward (120-180°/s) or leftward (−180 to −120°/s) head movements, optotypes were displayed for ≥ 40 ms. DVA was calculated as the difference between dynamic and static logMAR values. Results were classified as normal or abnormal according to the difference between static and DVA, with a degradation of ≥ 0.3 logMAR (≥ 3 lines).12 To minimize measurement bias, we utilized an automated computerized system that triggered optotypes only when the participant reached the target head velocity, thereby removing clinician subjectivity. To reduce selection bias, all patients who met the clinical criteria within the recruitment window were invited to participate.
Vestibular rehabilitation protocol
The vestibular rehabilitation program comprised five exercise components: gaze stabilization, balance training, cephalic movement exercises, weight-shifting tasks, and proprioceptive exercises. Gaze stabilization involved maintaining visual fixation on a target during head movement under static and dynamic conditions. Balance training consisted of tandem marching combined with head movements without visual fixation. Cephalic movement exercises combined tandem gait with head rotations while maintaining fixation on a visual target. Weight-shifting tasks involved anterior-posterior and lateral body movements during visual fixation. Proprioceptive exercises included toe rolling and side-to-side object manipulation using the feet. Each rehabilitation session lasted approximately 30 min, with approximately 6 min allocated to each exercise component and adjusted according to individual tolerance. If a participant was unable to tolerate a specific exercise, the protocol progressed to the next component to maintain session duration.
Statistical analysis
As this was an exploratory proof-of-concept study, the primary goal of the statistical analysis was to evaluate the direction and magnitude of the effect size rather than to achieve definitive hypothesis testing. A priori sample size estimation was performed using a paired t-test with α = 0.05 and 80% power, using conservative estimates derived from prior literature. Prior published data reported a mean DVA difference of 0.2 with a standard deviation of 0.1; a conservative estimate of a mean difference of 0.1 and a standard deviation of 0.2 was used.10
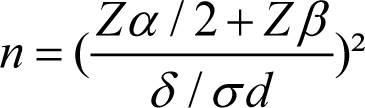
Where n represents the required sample size, Zα/2 corresponds to a two-sided significance level of 0.05 (1.96), Zβ corresponds to 80% power (0.84), σ d is the standard deviation of paired differences, and δ is the expected mean difference between pre- and post-intervention measurements. This yielded a required sample size of 32 participants. The achieved sample size was smaller than the a priori estimate, and results should therefore be interpreted with consideration of limited statistical power. Given the heterogeneity of the diagnostic groups, the analysis focused on the consistent sensitivity of the DVA across different vestibular pathologies to establish clinical utility. Data normality was assessed using the Shapiro-Wilk test. Descriptive statistics were calculated for all variables, including measures of central tendency and dispersion. Categorical variables were summarized as percentages. Paired t-tests compared pre- and post-intervention logMAR values. Missing data were addressed via complete-case analysis, as all 22 subjects completed both time points. All analyses were performed in STATA v14.
Results
Characteristics of the cohort
Twenty-two participants met the inclusion criteria and were included in the final analysis. The cohort was predominantly female (86.3%), with a mean age of 68.2 years (SD 14.2). The study population included a heterogeneous range of vestibular diagnoses encompassing peripheral, central, and functional disorders (Table 1), reflecting the routine case mix in a tertiary otoneurology service. Diagnostic heterogeneity was considered in the interpretation of outcome variability.
Table 1. Baseline demographic and clinical characteristics of the study population (n = 22)
| Variable | Measurement (n = 22) |
|---|---|
| Sex Female Male |
n (%) 19 (86.4) 3 (13.6) |
| Age (years), Mean ± SD | 68.2 ± 14.2 |
| Vestibular diagnosis Bilateral vestibulopathy Central dizziness Gait and mobility abnormalities Persistent postural-perceptual dizziness Right vestibular dysfunction Left vestibular dysfunction Central-origin vertigo Vestibular migraine Multisensory balance disorder Otosclerosis Meniere’s disease Cervical dizziness |
n (%) 4 (18.18) 2 (9.09) 2 (9.09) 2 (9.09) 2 (9.09) 2 (9.09) 2 (9.09) 1 (4.54) 1 (4.54) 1 (4.54) 1 (4.54) 1 (4.54) |
Demographic characteristics and vestibular diagnostic categories at study entry are summarized. Gender is reported as frequency and percentage, and age as mean ± standard deviation. Diagnoses include peripheral, central, and functional vestibular disorders, reflecting the clinical heterogeneity typical of a tertiary otoneurology service.
SD: standard deviation.
Distribution of DVA measures
All DVA variables demonstrated normal distribution on Shapiro-Wilk testing (all p > 0.05), supporting the use of parametric statistical analyses (Table 2).
Table 2. Shapiro-Wilk normality testing of dynamic visual acuity variables
| Measure | Right DVA (pre-rehabilitation) | Right DVA (post-rehabilitation) | Left DVA (pre-rehabilitation) | Left DVA (post-rehabilitation) | Average DVA (pre-rehabilitation) | Average DVA (post-rehabilitation) |
|---|---|---|---|---|---|---|
| Mean (logMAR) | 0.55 | 0.43 | 0.5 | 0.4 | 0.5 | 0.4 |
| SD (logMAR) | 0.33 | 0.3 | 0.4 | 0.27 | 0.35 | 0.3 |
| Shapiro-Wilk W | 0.93 | 0.97 | 0.92 | 0.97 | 0.94 | 0.98 |
| p | 0.156 | 0.806 | 0.08 | 0.746 | 0.236 | 0.876 |
Shapiro-Wilk statistics and corresponding p-values are reported for dynamic visual acuity measures obtained before and after rehabilitation. All variables met normality assumptions (p > 0.05), permitting the use of parametric analyses. Mean and SD values are reported for logMAR scores. DVA: dynamic visual acuity; logMAR: logarithm of the minimum angle of resolution; SD: standard deviation.
Changes in DVA following rehabilitation
A significant reduction in logMAR values in average DVA was observed after completion of five vestibular rehabilitation sessions (Table 3) (Fig. 1). Mean logMAR values decreased from 0.517 (SD 0.328) at baseline to 0.406 (SD 0.275) post-intervention (t = 2.856, p = 0.0095). The associated effect size was moderate (Cohen’s d = 0.61).
Table 3. Comparison of dynamic visual acuity (logMAR) before and after vestibular rehabilitation (n = 22)
| Parameter | Average DVA – baseline | Average DVA – Post-5 sessions | t statistic (df = 21) | p-value | Cohen’s d |
|---|---|---|---|---|---|
| Mean ± SD | 0.517 ± 0.328 | 0.406 ± 0.275 | 2.856 | 0.009 | 0.61 |
| Median (IQR) | 0.475 (0.430) | 0.410 (0.395) |
Values are presented as Mean ± SD and Median (IQR). Comparisons were performed using paired t-tests. Lower logMAR values indicate improved visual acuity during head motion. Results demonstrate a statistically significant improvement in DVA following the 5-session intervention (p < 0.01) with a moderate effect size (d = 0.61). DVA: dynamic visual acuity; df: degrees of freedom; IQR: interquartile range; logMAR: logarithm of the minimum angle of resolution; SD: standard deviation.
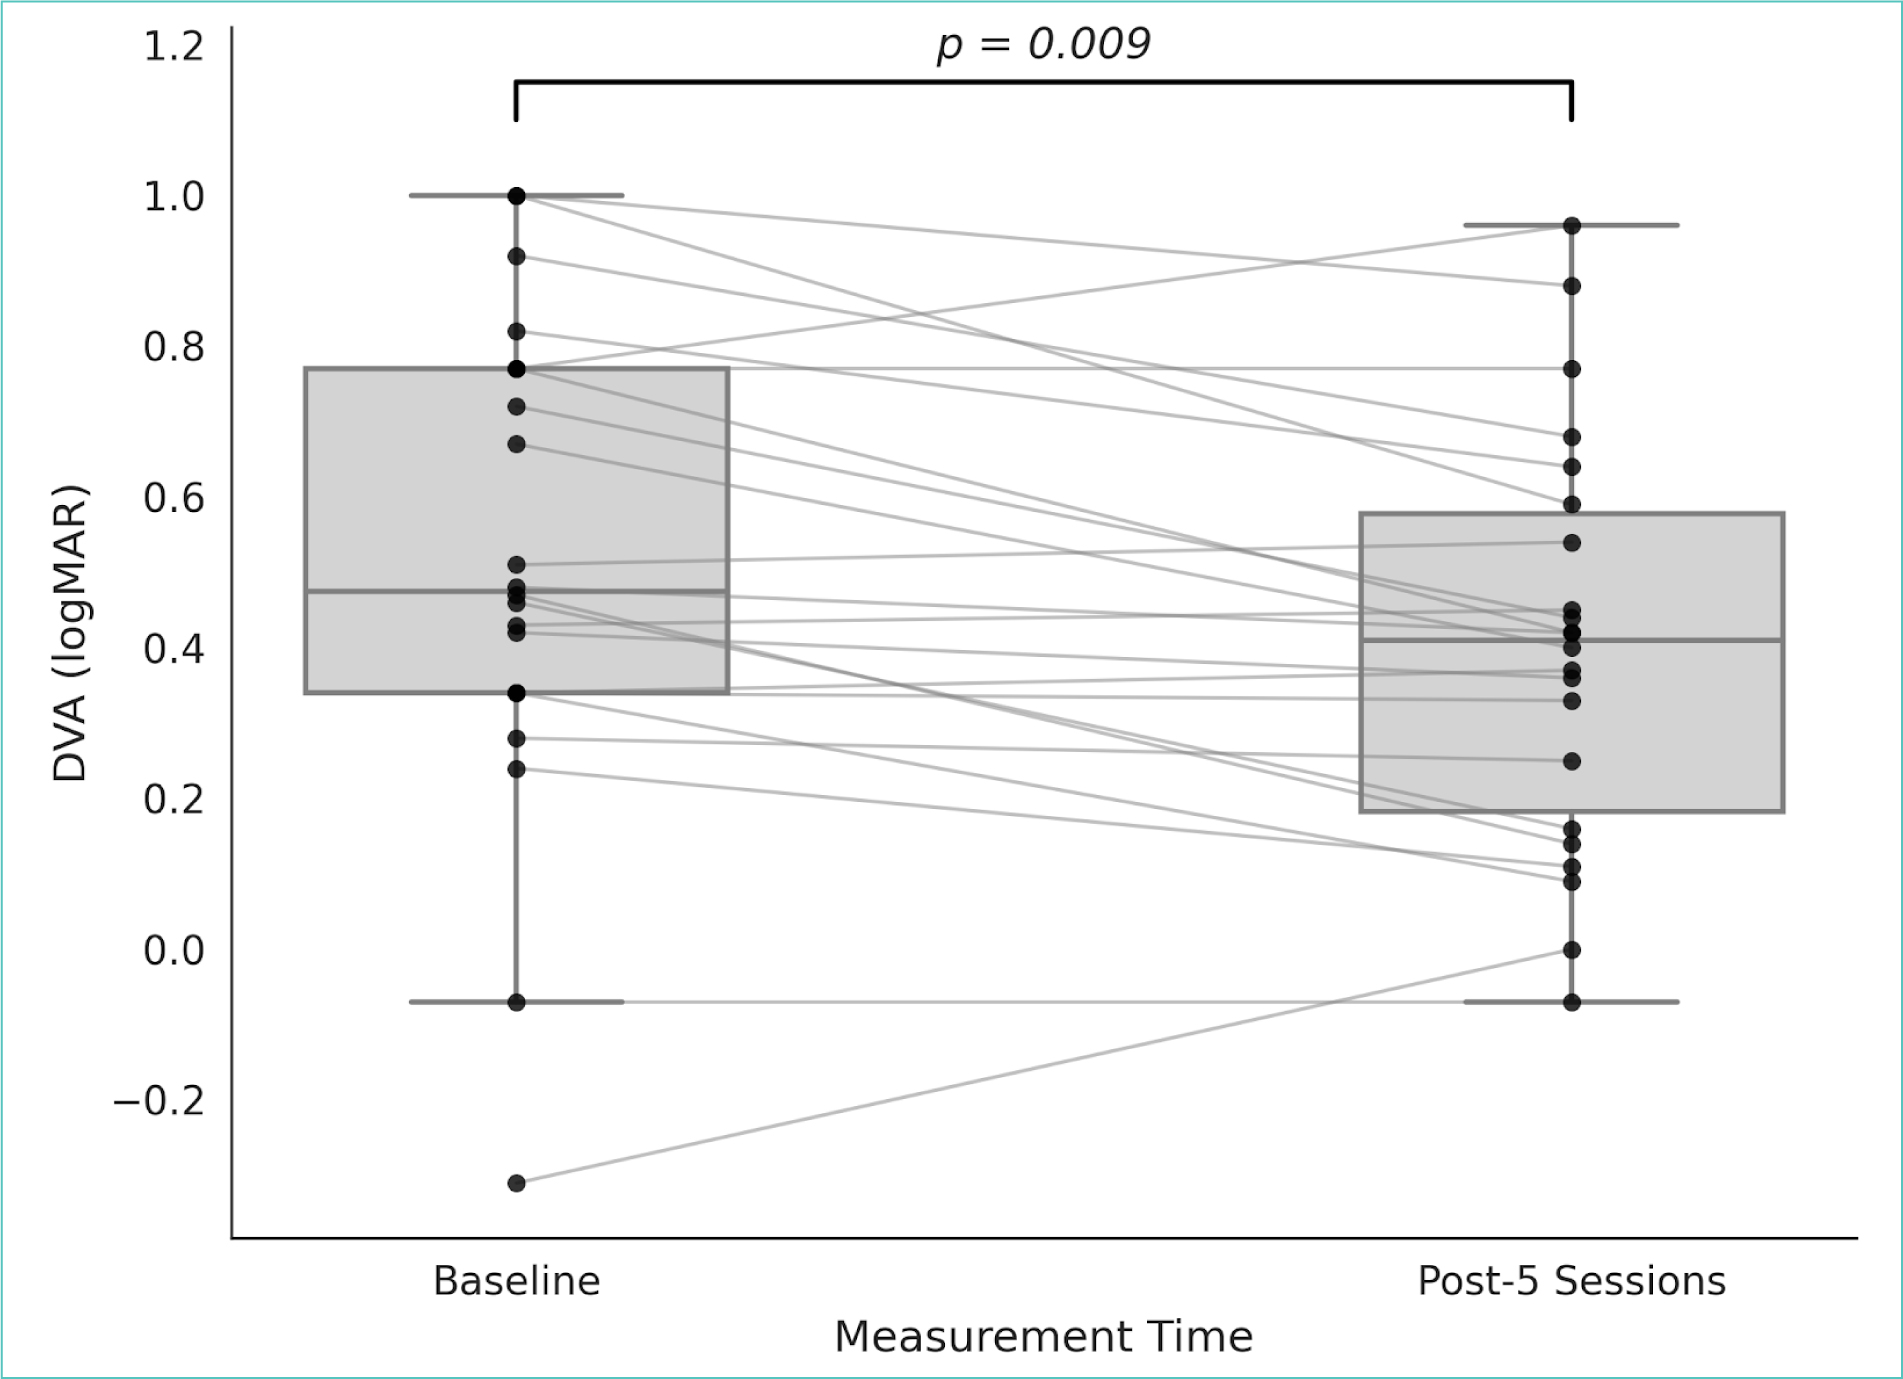
Figure 1. Change in average dynamic visual acuity before and after five sessions of rehabilitation. Individual patient trajectories (grey lines) and group distributions (boxplots) are shown for 22 participants. A significant improvement (reduction in logMAR) was observed after five sessions of vestibular rehabilitation (p = 0.009, paired t-test). Lower logMAR values indicate better visual acuity during active head movement.
DVA: dynamic visual acuity; logMAR: logarithm of the minimum angle of resolution.
Eye-specific analysis of DVA
When analyzed by eye, DVA demonstrated a statistically significant reduction in logMAR values for the right eye following completion of five rehabilitation sessions (p = 0.008; Cohen’s d = 0.62), as shown in table 4 and figure 2. In contrast, the change in left-eye DVA did not reach statistical significance (p = 0.082).
Table 4. Eye-specific changes in dynamic visual acuity before and after five sessions of rehabilitation
| Eye | Mean pre ± SD | Mean post ± SD | t | p | Cohen’s d | Significance |
|---|---|---|---|---|---|---|
| Right eye | 0.548 ± 0.327 | 0.428 ± 0.294 | 2.912 | 0.0083 | 0.62 | (p < 0.01) |
| Left eye | 0.485 ± 0.375 | 0.384 ± 0.268 | 1.823 | 0.0825 | 0.39 | (p > 0.05) |
Right-eye and left-eye dynamic visual acuity values were compared before and after the intervention using paired t-tests. Effect sizes were calculated using Cohen’s d to quantify the magnitude of change. Lower logMAR values indicate better visual acuity during head motion. A statistically significant change was observed for the right eye, whereas left-eye values showed a non-significant trend. These results indicate asymmetric changes in DVA across eyes within the cohort.
Plots display individual pre- and post-intervention DVA values for the right and left eyes (n = 22). A statistically significant reduction in logMAR values was observed for the right eye (p = 0.008, paired t-test), whereas the change in left-eye DVA did not reach statistical significance (p = 0.083). Individual participant trajectories are shown as grey lines, with group distributions presented as boxplots (median and interquartile range). Lower logMAR values indicate improved visual acuity during active head movement.
DVA: dynamic visual acuity; logMAR: logarithm of the minimum angle of resolution; SD: standard deviation.
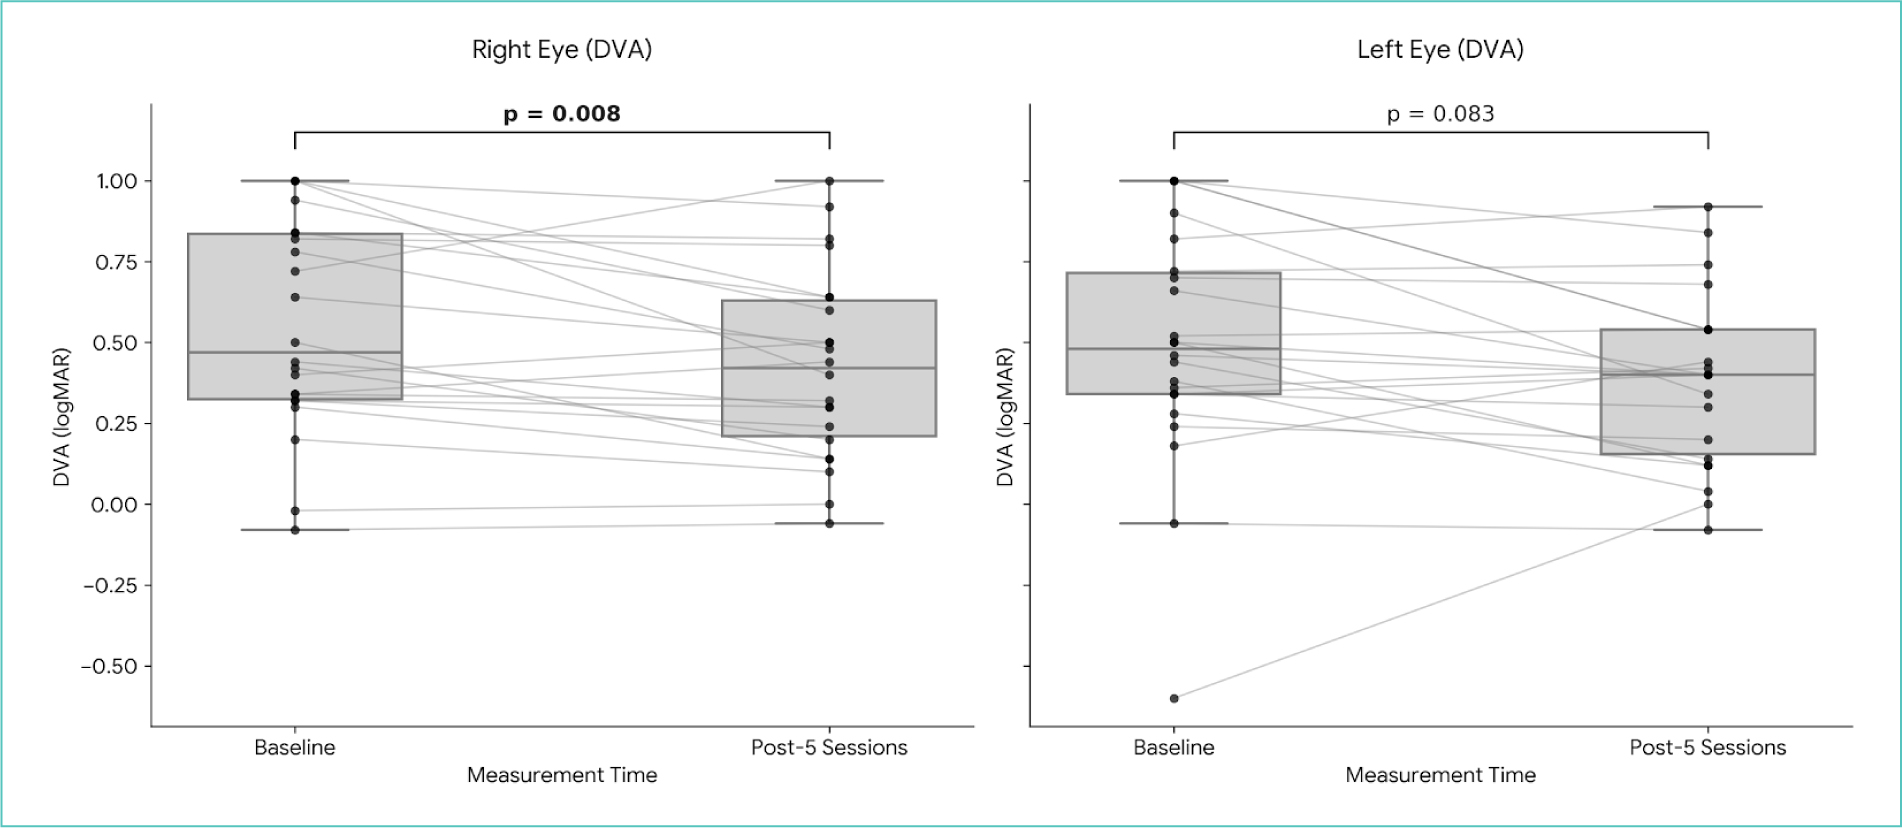
Figure 2. Comparison of lateral dynamic visual acuity outcomes.
DVA loss
The DVA loss, calculated as the difference between dynamic and SVA (dynamic VA-static VA), was analyzed to assess the discrepancy between static and motion-integrated visual performance. As shown in table 5 and 6, a statistically significant reduction in DVA loss was observed for the right eye following the five-session intervention (p = 0.008). The left eye demonstrated a similar reduction in mean loss, though this change did not reach statistical significance (p = 0.083). Following the intervention, mean DVA loss values improved to 0.26 logMAR in the right eye and 0.21 logMAR in the left eye. While these means fell below the 0.3 logMAR clinical reference threshold,12 the standard errors for both eyes overlapped with this threshold, reflecting the variability of functional outcomes within the cohort.
Table 5. Dynamic visual acuity loss before and after five sessions of rehabilitation
| Condition | Baseline (Mean ± SD) | Post-5 sessions (Mean ± SD) | t | p (Paired) |
|---|---|---|---|---|
| Right eye DVA loss | 0.377 ± 0.220 | 0.257 ± 0.221 | 2.898 | 0.008 |
| Left eye DVA loss | 0.315 ± 0.302 | 0.213 ± 0.180 | 1.821 | 0.083 |
DVA loss represents the functional loss of acuity during head motion compared to static conditions. Values are presented as mean ± standard deviation. Pre- and post-intervention values were compared using paired t-tests. Lower values indicate a smaller discrepancy between static and dynamic visual acuity. While a significant reduction was observed in the right eye, mean values for both eyes remained above the 0.3 logMAR threshold.
logMAR: logarithm of the minimum angle of resolution; SD: standard deviation.
Table 6. Comparison of lateralized dynamic visual acuity outcomes (n = 22)
| Measure | Baseline (Mean ± SD) | Post-5 sessions (Mean ± SD) | t-statistic | p | Cohen’s d |
|---|---|---|---|---|---|
| Right eye | |||||
| DVA | 0.548 ± 0.327 | 0.428 ± 0.294 | 2.912 | 0.008 | 0.62 |
| DVA Loss | 0.377 ± 0.220 | 0.257 ± 0.221 | |||
| Left eye | |||||
| DVA | 0.485 ± 0.375 | 0.384 ± 0.268 | 1.823 | 0.083 | 0.39 |
| DVA Loss | 0.315 ± 0.302 | 0.213 ± 0.180 | |||
DVA values represent absolute logMAR acuity during head motion, whereas DVA Loss represents the difference between dynamic and static acuity. Because static acuity remained constant, the statistical comparisons (paired t-tests) and effect sizes (Cohen’s d) are identical for both absolute and loss measures.
DVA: dynamic visual acuity; logMAR, logarithm of the minimum angle of resolution; SD: standard deviation.
Eye-specific analysis revealed a statistically significant improvement in both absolute DVA and functional loss for the right eye following the five-session intervention (p = 0.008; d = 0.62). Specifically, mean right-eye DVA improved from 0.548 to 0.428 logMAR, reflecting a corresponding reduction in the functional loss, defined as the difference between dynamic and SVA, from 0.377 to 0.257 logMAR (Table 4) (Fig. 3).
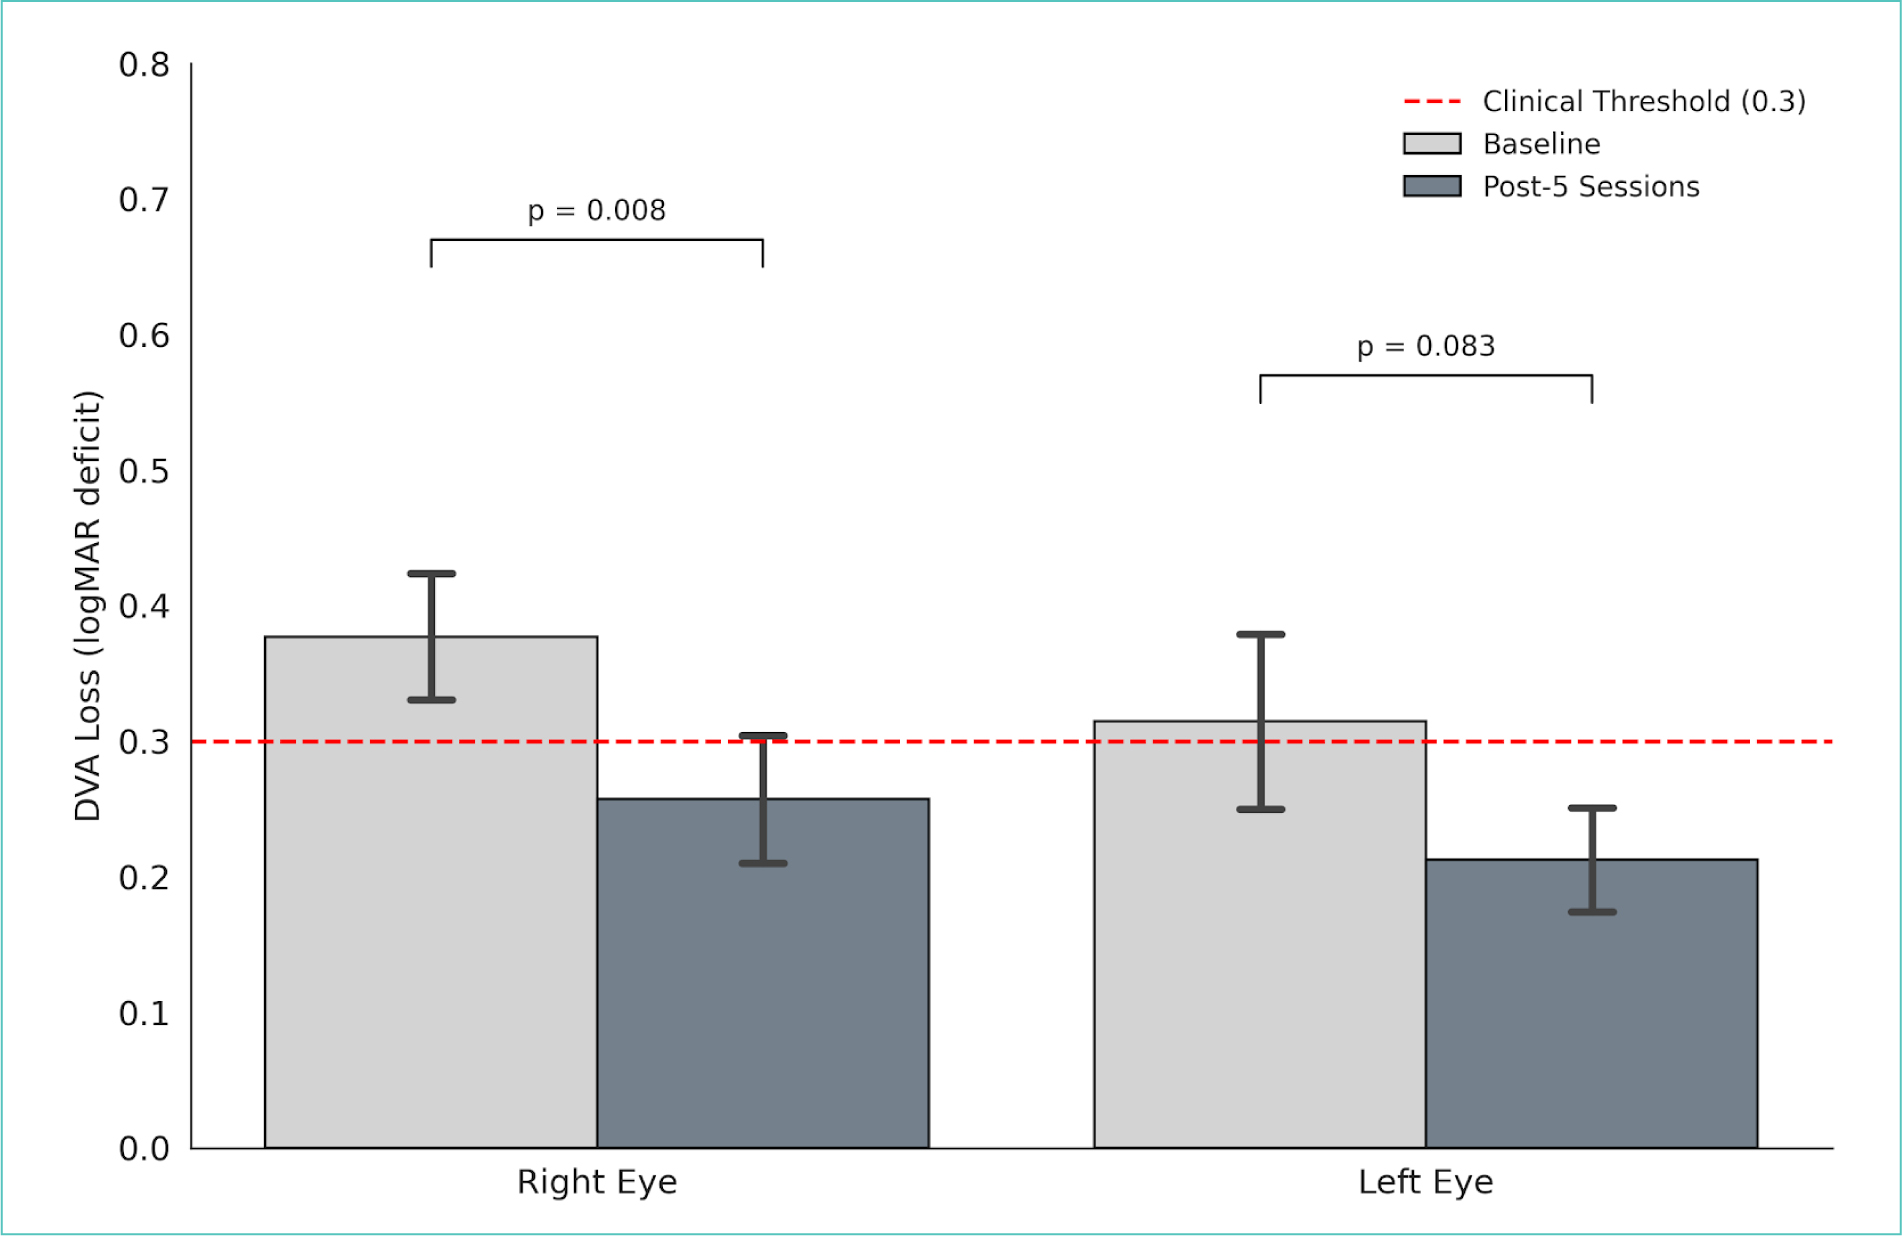
Figure 3. Mean dynamic visual acuity loss before and after rehabilitation. Bar plots display the mean DVA loss (calculated as dynamic VA-static VA) for the right and left eyes at baseline and after five rehabilitation sessions. Error bars represent the standard error of the mean. The red dashed line indicates the commonly used clinical reference threshold of 0.3 logMAR. A statistically significant reduction in DVA loss was observed for the right eye (p = 0.008), whereas the improvement in the left eye followed a similar trend (p = 0.083).
DVA: dynamic visual acuity; logMAR: logarithm of the minimum angle of resolution.
Measurements for the left eye demonstrated a similar downward trend in both raw acuity and functional loss, although these changes did not reach statistical significance (p = 0.083). While these results indicate a reduction in the discrepancy between static and motion-integrated visual performance, the mean post-intervention loss values for both eyes remained above the 0.3 logMAR clinical reference threshold.12 This persistence of abnormal values highlights a partial functional change without full normalization of visual performance during head motion within the short clinical interval.
Discussion
This study identified statistically significant changes in DVA following completion of a short rehabilitation protocol, with the largest magnitude of change observed in right-eye measures. DVA was selected as a behavioral outcome because it reflects the functional consequences of VOR impairment on visual performance during head motion, rather than isolated physiologic parameters. The observed reduction in DVA is consistent with prior reports indicating that gaze-stability-focused interventions are associated with measurable changes in visual performance during movement.6–10
An important contribution of this study is the demonstration that logMAR-based, cDVA testing can detect measurable change over a relatively brief clinical interval. Standardized control of head velocity and optotype presentation enhances measurement sensitivity and reduces variability associated with bedside or chart-based assessments.2,3 These characteristics support the utility of DVA as a quantitative behavioral outcome for monitoring functional vestibular status in both clinical and research contexts, particularly when laboratory-based vestibular testing is unavailable or impractical.
Following the five-session intervention, mean DVA loss values improved to 0.26 logMAR for the right eye and 0.21 logMAR for the left eye. While these mean values fell below the 0.3 logMAR threshold typically associated with abnormal DVA,12 the overlap of standard error bars with this clinical reference point suggests that a subset of the cohort did not achieve full normalization of visual performance during head motion. The presence of these residual losses following a short-duration intervention is consistent with prior literature, which indicates that the full recovery of dynamic visual function may require longer treatment duration, increased dosage, or specialized task-specific adaptation.8,10 Consequently, these findings emphasize the necessity of evaluating both statistical improvement and attainment of clinically referenced thresholds when interpreting functional DVA outcomes.
Eye-specific analysis revealed an asymmetric pattern of change, with statistically significant reductions observed in right-eye DVA but not in left-eye measures. While this finding raises the possibility of lateralized processing differences, the present study was not designed to evaluate hemispheric dominance, lesion laterality, or central integration asymmetries. Previous neurophysiological and neuroimaging studies have demonstrated hemispheric specialization within vestibular cortical networks, including the parieto-insular vestibular cortex, which may be relevant to asymmetric behavioral responses.11,13 In this cohort, laterality findings should be interpreted cautiously and viewed as hypothesis-generating rather than confirmatory.
From a functional standpoint, DVA provides insight into visual performance during head motion, a task relevant to everyday activities such as walking, turning, and navigating complex environments. Even modest changes in DVA may be relevant for monitoring functional status over time, particularly in older adults or individuals with chronic vestibular symptoms. The use of DVA as an outcome measure allows clinicians and researchers to quantify change in a manner that is directly linked to visual behavior rather than inferred from physiologic surrogates.
Several limitations warrant consideration. The design limits control over potentially relevant variables, including symptom duration, vestibular lesion characteristics, and comorbid sensory or cognitive factors. The achieved sample size was smaller than estimated, reducing power for subgroup and laterality analyses. Diagnostic heterogeneity reflects routine clinical practice but may obscure condition-specific patterns of change. In addition, the rehabilitation protocol reflected standard care rather than a standardized experimental intervention, limiting inference regarding optimal dosing or content.
While our heterogeneous cohort demonstrated the clinical versatility of DVA across various vestibular pathologies, future studies should employ stratification by vestibular diagnosis and lesion laterality, and longitudinal follow-up to characterize the time course of DVA change. Integration of behavioral outcomes such as DVA with physiologic vestibular measures may further clarify their complementary roles in assessing functional vestibular recovery.11–13
Conclusion
Five sessions of vestibular rehabilitation were associated with statistically significant improvements in DVA, with significant changes observed in right-eye measures and a non-significant improvement trend in the left eye. While mean post-intervention values for both eyes fell below the 0.3 logMAR clinical reference threshold, the persistence of individual variability and overlapping standard errors suggests that functional normalization remained partial for a subset of the cohort.
The consistent response observed across a diagnostically heterogeneous group suggests a general vestibular functional profile rather than disorder-specific effects. DVA proved to be a sensitive behavioral metric for monitoring functional changes over short clinical intervals, emphasizing the critical role of rehabilitation dose when interpreting functional recovery. Future prospective studies are necessary to define optimal intervention durations and refine outcome selection criteria for clinical practice.
Conflicts of interest
The authors declare no potential conflicts of interest with respect to the research, authorship, and/or publication of this article.
Funding
Not applicable.
Ethical considerations
Protection of human subjects and animals. The authors declare that no experiments on humans or animals were performed for this research.
Confidentiality, informed consent, and ethical approval. The authors have obtained approval from the Ethics Committee for the analysis of routinely collected and anonymized clinical data; therefore, individual informed consent was not required. Relevant ethical recommendations have been followed.
Declaration on the use of artificial intelligence. The authors declare that no generative artificial intelligence was used in the writing or creation of the content of this manuscript.
